Dstat提供了有关Linux系统性能的宝贵见解,几乎取代了较旧的工具,如vmstat,netstat,iostat和ifstat。
想要对Linux系统进行快速性能检查吗? 您可能需要查看dstat命令。 Dstat提供了有关Linux系统性能的宝贵见解,几乎取代了一系列旧工具,如vmstat,netstat,iostat和ifstat,它们具有结合其功能的灵活而强大的命令。
使用这一个命令,您可以查看虚拟内存,网络连接和接口,CPU活动,输入/输出设备等。 在今天的帖子中,我们将检查一些dstat命令,看看它们可以向您展示有关系统的内容。
Dstat选项和默认值
首先,让我们从一个相当简单的命令开始。 使用dstat -c(CPU)选项,dstat显示CPU统计信息。 在下面的示例中,我们要求两秒间隔和六个报告。
linuxidc@linuxidc:~/www.linuxidc.com/Linux公社$ dstat -c 2 6
–total-cpu-usage–
usr sys idl wai stl
4 2 94 0 0
29 6 65 0 0
26 14 60 0 0
48 13 39 0 0
68 20 13 0 0
38 10 52 1 0
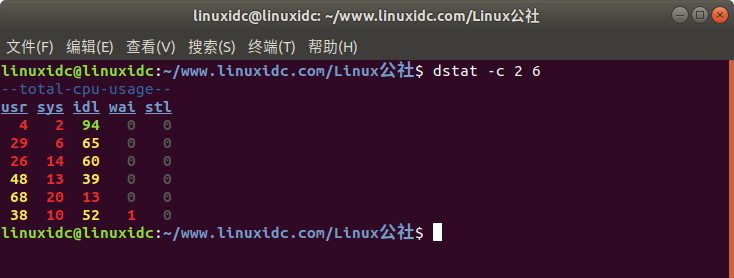
请注意,此报告中的第一行数据看起来与其他数据非常不同,它们为您提供自系统上次引导以来的平均值,并且无论指定的时间间隔如何都会立即返回。 在这个例子中,我们看到系统平均空闲(96%),但现在在用户和系统处理任务之间忙着工作。
如果您没有为dstat提供任何选项,该命令将使用默认设置(-cdngy)选项集。 这些包括:
- c – cpu
- d – 磁盘
- n – 网络
- g – 分页统计
- y – 系统统计数据
此命令的输出将类似于您在下面看到的内容。
linuxidc@linuxidc:~/www.linuxidc.com/Linux公社$ dstat 2 10
You did not select any stats, using -cdngy by default.
–total-cpu-usage– -dsk/total- -net/total- —paging– —system–
usr sys idl wai stl| read writ| recv send| in out | int csw
4 2 94 0 0| 220k 216k| 0 0 |4407B 27k| 129 662
28 6 66 0 0| 0 0 | 0 0 | 0 0 | 431 1184
50 17 33 0 0|2048B 12k| 0 193B|2048B 0 | 430 1507
33 8 59 0 0| 0 0 | 0 0 | 0 0 | 440 1324
31 11 58 0 0|2048B 0 | 0 0 | 0 0 | 410 1373
26 4 69 1 0|4096B 28k| 0 0 | 0 0 | 354 1074
63 34 4 0 0| 0 128k| 90B 0 | 0 0 | 302 2154
32 10 58 0 0| 0 152k| 60B 0 | 0 0 | 402 1508
16 14 69 0 0| 0 0 | 75B 45B| 0 0 | 495 1763
15 6 79 0 0| 0 70k| 90B 0 | 0 0 | 263 931
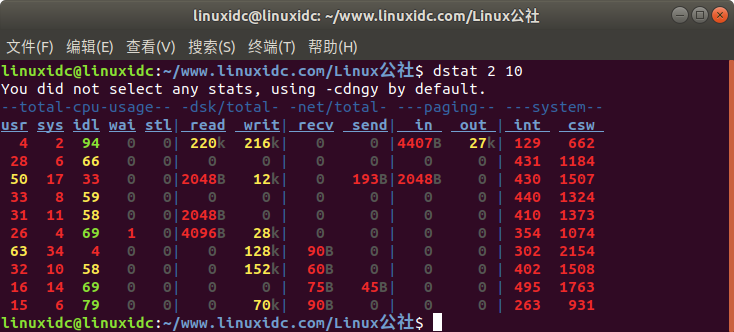
您可能已经注意到上面显示的输出顶部附近的“您没有选择任何统计信息”消息。 要轻松解决这个问题,只需添加-a选项即可。 它将选择默认选项并省略警告消息。
linuxidc@linuxidc:~/www.linuxidc.com/Linux公社$ dstat -a 2 5
–total-cpu-usage– -dsk/total- -net/total- —paging– —system–
usr sys idl wai stl| read writ| recv send| in out | int csw
4 2 94 0 0| 218k 215k| 0 0 |4386B 26k| 130 663
8 5 88 0 0| 0 24k| 30B 0 | 0 0 | 229 724
27 5 68 0 0| 0 0 | 60B 0 | 0 0 | 372 993
26 5 68 0 0| 0 0 | 60B 0 | 0 0 | 478 1410
32 8 60 0 0| 0 0 | 30B 0 | 0 0 | 453 1585
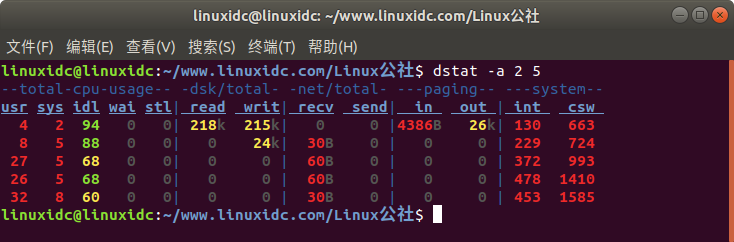
在这种“无选项”方法中,您仍然可以设置每个时间间隔的时间(以秒为单位)以及要查看的时间间隔数。 如果未指定间隔数,则命令将继续运行,直到您使用^ c停止它。
这告诉你什么?
在上面显示的输出中,我们看到了被查询的系统相当繁忙的证据。 没有报告空闲时间; CPU将所有时间都花在用户和系统任务之间。 将此与报告进行比较,报告显示系统闲置的时间是一半。
linuxidc@linuxidc:~/www.linuxidc.com/Linux公社$ dstat -a 2
–total-cpu-usage– -dsk/total- -net/total- —paging– —system–
usr sys idl wai stl| read writ| recv send| in out | int csw
4 2 94 0 0| 218k 215k| 0 0 |4369B 26k| 130 661
16 7 77 0 0| 0 26k| 0 0 | 0 0 | 325 1159
13 3 84 0 0|2048B 6144B| 0 0 |2048B 0 | 215 515
64 13 23 0 0|2048B 10k| 0 0 |2048B 0 | 388 1576
32 9 59 0 0| 0 0 | 0 0 | 0 0 | 496 1414
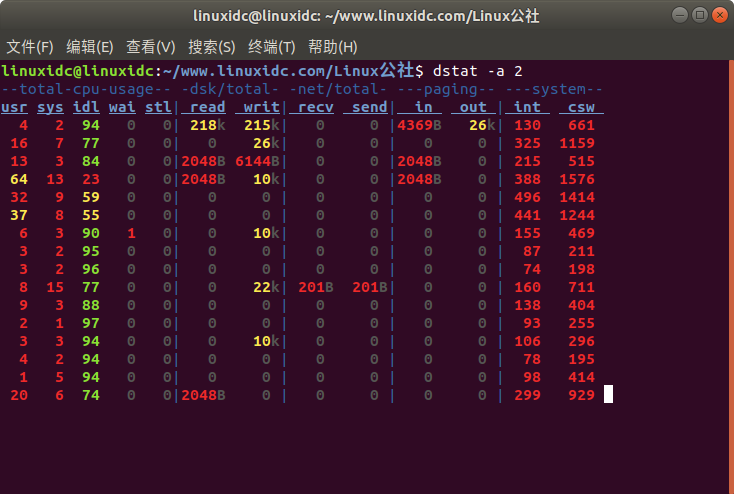
另一方面,磁盘一点也不繁忙,读写为零。
要想熟练地评估系统性能,一个关键就是定期运行这些命令——即使你不知道有必要质疑系统运行得有多好。如果您了解了服务器的正常性能,您将更容易发现问题。
这是另一个例子,这个有一些磁盘活动:
linuxidc@linuxidc:~/www.linuxidc.com/Linux公社$ dstat -a 2 5
–total-cpu-usage– -dsk/total- -net/total- —paging– —system–
usr sys idl wai stl| read writ| recv send| in out | int csw
4 2 94 0 0| 214k 211k| 0 0 |4293B 26k| 130 656
9 6 85 0 0|6144B 0 | 0 0 | 0 0 | 218 752
6 2 92 0 0| 0 20k| 30B 0 | 0 0 | 141 355
3 2 95 0 0| 0 0 | 60B 0 | 0 0 | 79 212
2 1 97 0 0| 0 0 | 60B 0 | 0 0 | 72 194
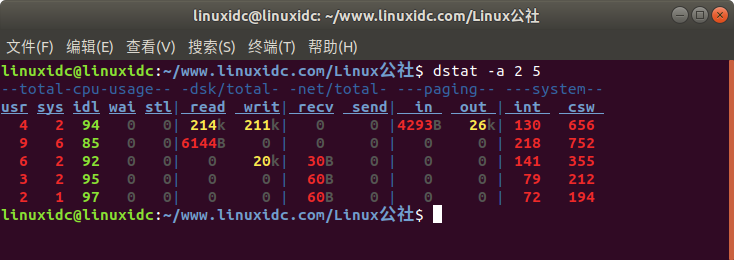
在所有这些示例中,我们没有看到任何分页(将可执行映像加载到进程的虚拟内存中)活动。 有一个相当恒定的中断和上下文切换正在进行,但数字都非常适度。
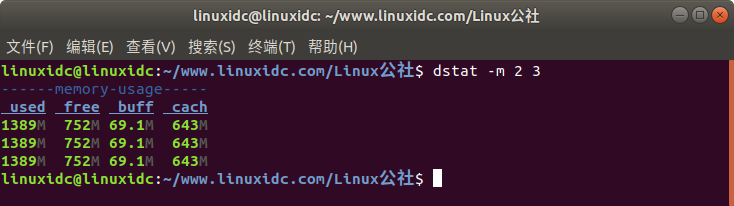
在下面的命令中,我们正在查看内存使用情况报告。 请注意与正在使用的内存相比的可用内存量。 这个系统没有受到挑战。
linuxidc@linuxidc:~/www.linuxidc.com/Linux公社$ dstat -m 2 3
——memory-usage—–
used free buff cach
1389M 752M 69.1M 643M
1389M 752M 69.1M 643M
1389M 752M 69.1M 643M
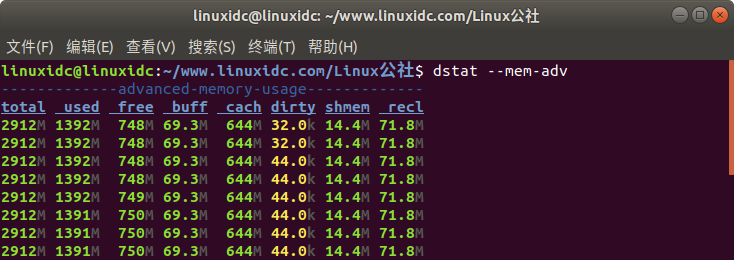
在下一个命令中,我们正在查看高级内存使用情况报告。 提供了一些额外的内存统计信息
linuxidc@linuxidc:~/www.linuxidc.com/Linux公社$ dstat –mem-adv
————-advanced-memory-usage————-
total used free buff cach dirty shmem recl
2912M 1392M 748M 69.3M 644M 32.0k 14.4M 71.8M
2912M 1392M 748M 69.3M 644M 32.0k 14.4M 71.8M
2912M 1392M 748M 69.3M 644M 44.0k 14.4M 71.8M
2912M 1392M 748M 69.3M 644M 44.0k 14.4M 71.8M
2912M 1392M 749M 69.3M 644M 44.0k 14.4M 71.8M
2912M 1391M 750M 69.3M 644M 44.0k 14.4M 71.8M
2912M 1391M 750M 69.3M 644M 44.0k 14.4M 71.8M
2912M 1391M 750M 69.3M 644M 44.0k 14.4M 71.8M
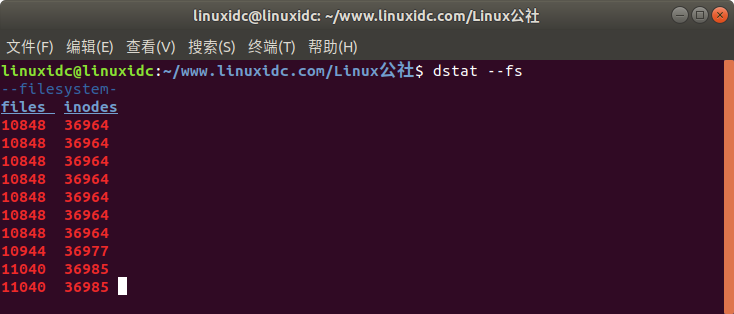
在下一个命令中,我们正在查看正在使用的打开文件和inode。
linuxidc@linuxidc:~/www.linuxidc.com/Linux公社$ dstat –fs
–filesystem-
files inodes
10848 36964
10848 36964
10848 36964
10848 36964
10848 36964
10848 36964
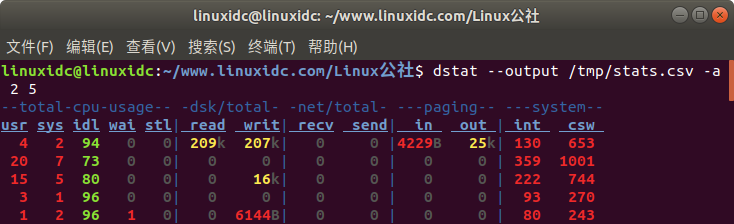
在最后一个示例中,我们生成标准报告,但添加了一个。 我们还将报告写入.csv文件,以便可以在其他工具(如Excel)中使用。
linuxidc@linuxidc:~/www.linuxidc.com/Linux公社$ dstat –output /tmp/stats.csv -a 2 5
–total-cpu-usage– -dsk/total- -net/total- —paging– —system–
usr sys idl wai stl| read writ| recv send| in out | int csw
4 2 94 0 0| 209k 207k| 0 0 |4229B 25k| 130 653
20 7 73 0 0| 0 0 | 0 0 | 0 0 | 359 1001
15 5 80 0 0| 0 16k| 0 0 | 0 0 | 222 744
3 1 96 0 0| 0 0 | 0 0 | 0 0 | 93 270
1 2 96 1 0| 0 6144B| 0 0 | 0 0 | 80 243
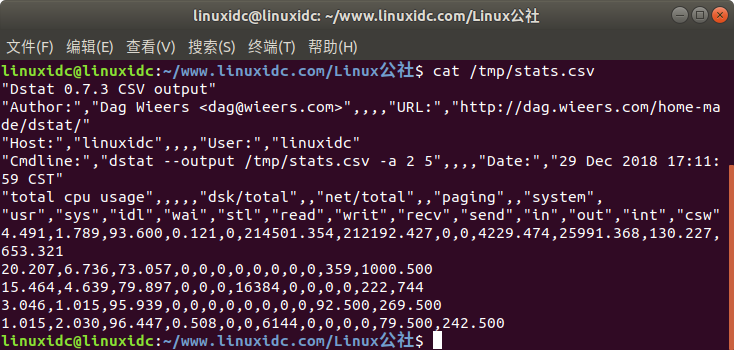
这是csv文件的样例:
linuxidc@linuxidc:~/www.linuxidc.com/Linux公社$ cat /tmp/stats.csv
“Dstat 0.7.3 CSV output”
“Author:”,”Dag Wieers <dag@wieers.com>”,,,,”URL:”,”http://dag.wieers.com/home-made/dstat/”
“Host:”,”linuxidc”,,,,”User:”,”linuxidc”
“Cmdline:”,”dstat –output /tmp/stats.csv -a 2 5″,,,,”Date:”,”29 Dec 2018 17:11:59 CST”
“total cpu usage”,,,,,”dsk/total”,,”net/total”,,”paging”,,”system”,
“usr”,”sys”,”idl”,”wai”,”stl”,”read”,”writ”,”recv”,”send”,”in”,”out”,”int”,”csw”
4.491,1.789,93.600,0.121,0,214501.354,212192.427,0,0,4229.474,25991.368,130.227,653.321
20.207,6.736,73.057,0,0,0,0,0,0,0,0,359,1000.500
15.464,4.639,79.897,0,0,0,16384,0,0,0,0,222,744
3.046,1.015,95.939,0,0,0,0,0,0,0,0,92.500,269.500
1.015,2.030,96.447,0.508,0,0,6144,0,0,0,0,79.500,242.500
什么是dstat?
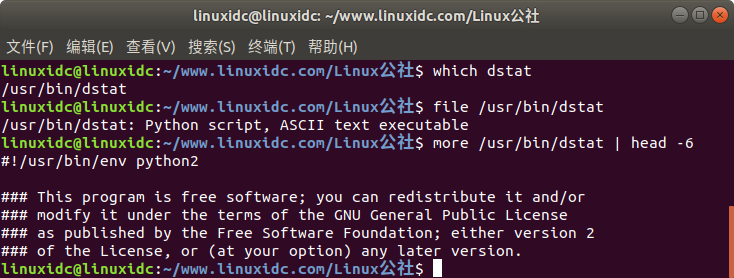
如前所述,dstat是一个很好的工具,可用于查看系统性能的所有方面。 但是这个问题的另一个答案是它是一个Python脚本,如果你想看看它是如何工作的,你可以自由地阅读它。
linuxidc@linuxidc:~/www.linuxidc.com/Linux公社$ which dstat
/usr/bin/dstat
linuxidc@linuxidc:~/www.linuxidc.com/Linux公社$ file /usr/bin/dstat
/usr/bin/dstat: Python script, ASCII text executable
linuxidc@linuxidc:~/www.linuxidc.com/Linux公社$ more /usr/bin/dstat | head -6
#!/usr/bin/env python2
### This program is free software; you can redistribute it and/or
### modify it under the terms of the GNU General Public License
### as published by the Free Software Foundation; either version 2
### of the License, or (at your option) any later version.